The Upgrade Groups section shows how subscribers respond to your upsell campaigns. It tracks engagement, conversions, and revenue across banners, products, and upgrade groups, helping you spot high-performing campaigns, optimize offers, and grow recurring revenue.
Overview
The Upgrade Groups dashboard provides insights into how users interact with your upgrade banners and promotions. It tracks engagement, conversions, revenue, and downgrades, helping you evaluate the effectiveness of upsell campaigns and optimize upgrade strategies.
Time Period
You can select a date range to view upgrade metrics. Options include:
- Today
- Yesterday
- This Week
- Last Week
- This Month
- Last Month
- Quarter to Date
- Last Quarter
- Year to Date
- Last Year
- On Specific Date
- Custom Range

Note: You can compare Upgrade groups across different periods to help measure campaign performance over time.

Overview Metrics
This section summarizes key upgrade metrics for the selected period:
- Total Banner Views: Number of times upgrade banners were viewed.
- Total Banner Clicked: Number of times users clicked on upgrade banners.
- Conversions: Number of users who successfully upgraded.
- Conversion Rate: Percentage of clicks that resulted in successful upgrades.
- Revenue: Total revenue generated from upgrades.
- Net MRR: Monthly recurring revenue gained from upgrades.
- Net ARR: Annual recurring revenue gained from upgrades.
- Downgrades: Number of users who downgraded.

These metrics provide a snapshot of upgrade campaign effectiveness and highlight areas to optimize for better performance.
Upgrade Performance
This section tracks upgrade performance by both revenue growth and conversion rate over time. It helps you:
- Identify high-converting periods
- Monitor revenue growth from upgrades
- Spot patterns in user engagement with upgrade banners
- Track downgrades and subscription changes
You can hover over data points to view exact values and switch the graph view between daily and weekly intervals for flexible trend analysis.

Performance Summary
This section provides a detailed day-by-day performance summary of your upgrade groups. It helps you understand how your banners are performing by showing key metrics for each date, including:
- Banner Views: How many times the upgrade banner was displayed.
- Banner Clicked: The number of users who clicked the banner.
- Conversions: How many users completed the upgrade after clicking.
- Revenue: Total revenue generated from upgrades on that date.
- Conversion Rate: The percentage of clicks that resulted in conversions.
- Downgrades: The number of customers who downgraded their plan on that day.

Groups
The Groups tab provides detailed analytics for different upgrade groups or campaigns. It helps you evaluate performance at the group level, understand which upgrade offers are most effective, and compare user engagement across multiple upgrade types.
Time Period
You can select a date range to view upgrade group metrics. Options include:
- Today
- Yesterday
- This Week
- Last Week
- This Month
- Last Month
- Quarter to Date
- Last Quarter
- Year to Date
- Last Year
- On a Specific Date
- Custom Date Range
Note: You can also compare upgrade groups data between two time durations.

Overview
For each upgrade group, the following metrics are tracked:
- Active Upgrade Offers: Number of upgrade offers currently active in the group.
- Banner Views: Number of times upgrade banners were displayed to users.
- Banner Clicks: Number of times users clicked on banners.
- Conversions: Number of successful upgrades attributed to the group.
- Revenue: Total revenue generated from upgrades in the group.
- Net MRR: Monthly recurring revenue gained from upgrades in the group.
These metrics allow you to compare the performance of multiple groups and identify which campaigns are driving the most engagement and revenue.

Group Performance Insights
When you expand an upgrade group, you’ll see all the individual upgrade paths that fall under that group.
Next, you can expand each upgrade variation to track two layers of information:
1. Overall Performance Metrics
For each upgrade variation, you will first see three key metrics that summarize its performance:
- Views: How many times have customers seen the upgrade option.
- Conversions: How many customers accepted the upgrade.
- Revenue: Total revenue generated from all upgrades in this variation.
These metrics help you quickly understand how well that upgrade option is performing.
2. Selling Plan Transitions
Below the performance summary, you’ll find a detailed breakdown of how customers moved between selling plans.

Conversions
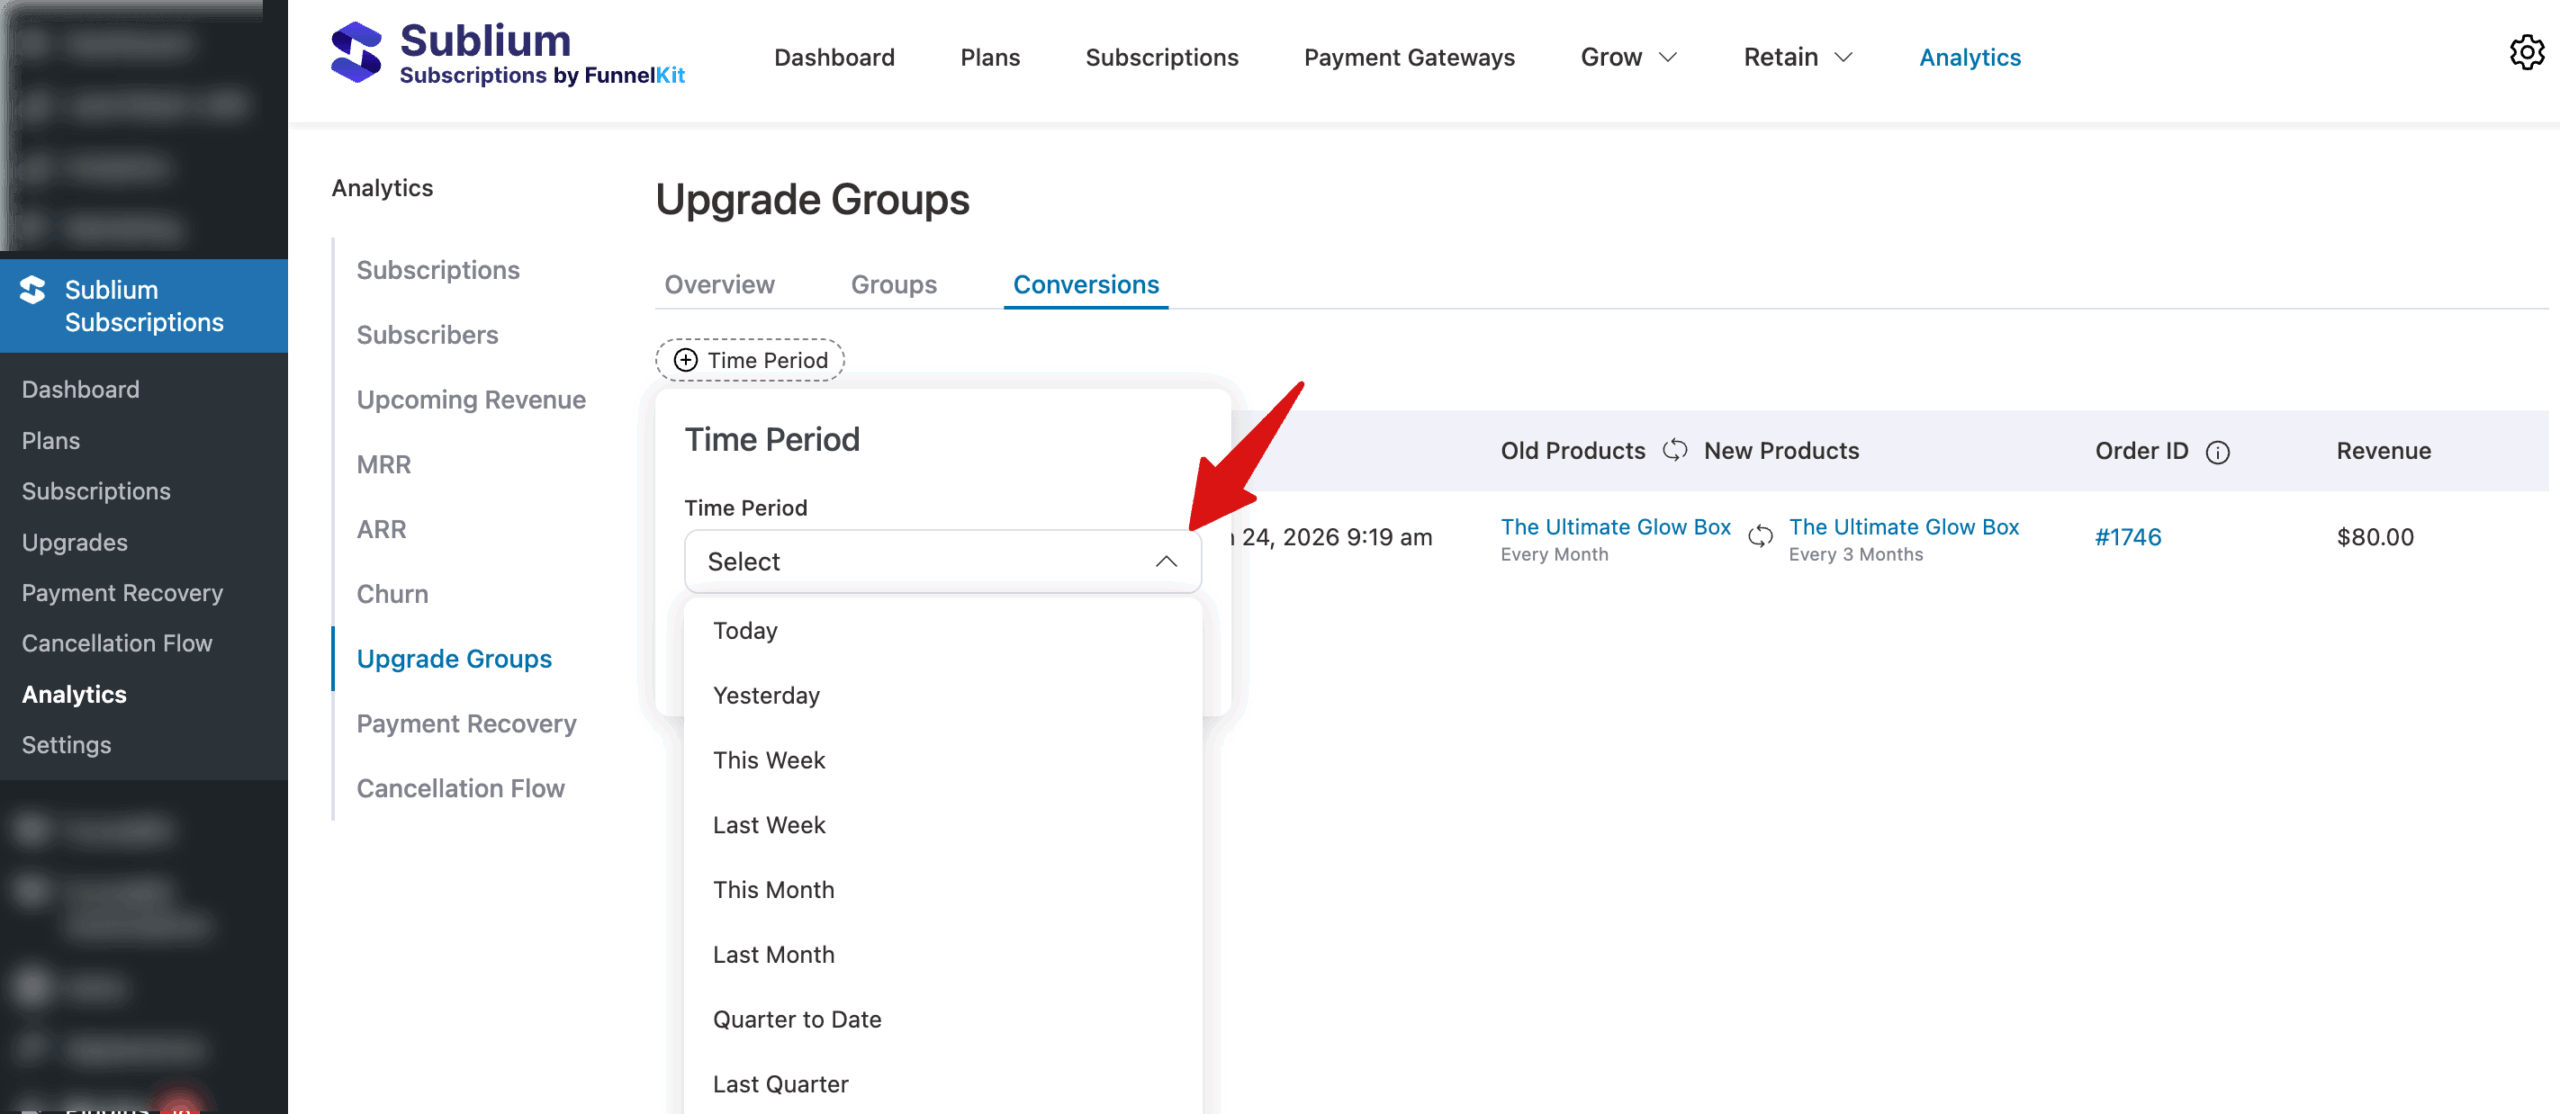
The Conversions tab provides detailed analytics on user upgrades, showing how subscribers move from old products or plans to new ones. It helps you track the effectiveness of upsell campaigns and understand how subscription changes contribute to revenue growth.
Time Period
You can select a date range to view conversion data. Options include:
- Today
- Yesterday
- This Week
- Last Week
- This Month
- Last Month
- Quarter to Date
- Last Quarter
- Year to Date
- Last Year
- On a Specific Date
- Custom Date Range
Overview
This section provides a detailed look at subscriber upgrades, showing how users move from their old products or plans to new ones. This helps you understand the effectiveness of upsell campaigns and their impact on revenue.
For each conversion, the following metrics are tracked:
- Subscriber: The name or identifier of the subscriber who upgraded.
- Date: The date and time when the conversion occurred.
- Old Products 🔄 New Products: Shows the transition from the subscriber’s previous products or plans to the upgraded products or plans.
- Order ID: Unique identifier for the upgrade order.
- Revenue: Revenue generated from the upgrade.

This view provides a granular understanding of subscriber behavior, allowing you to track which upgrades drive revenue, monitor product adoption, and optimize upsell strategies.

